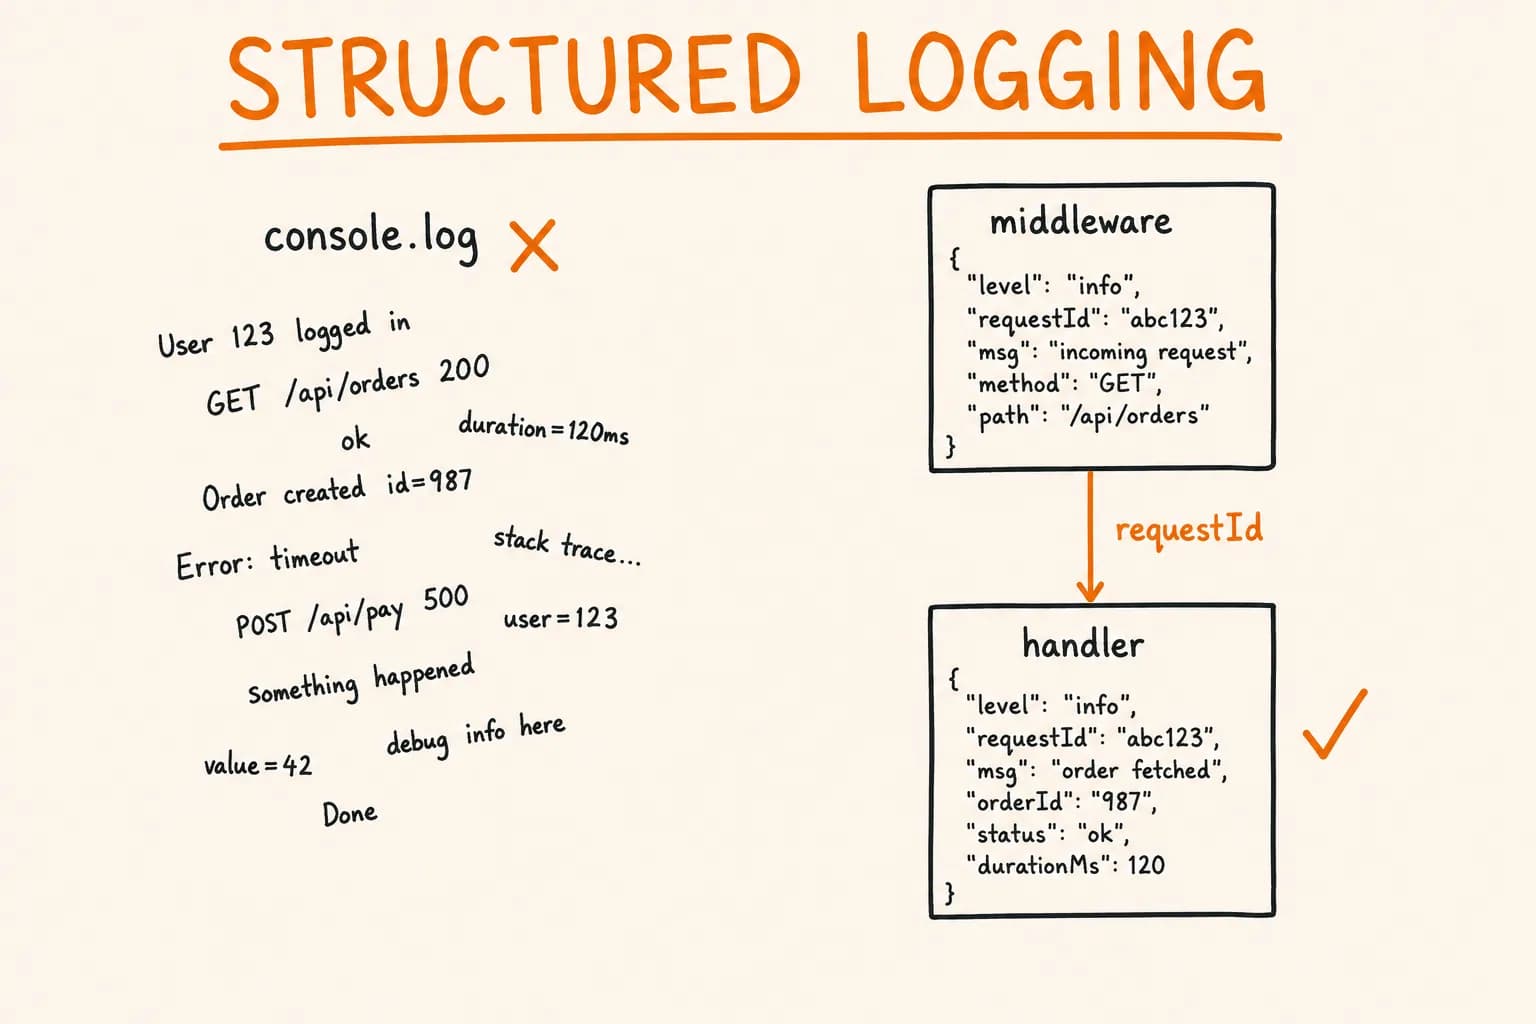
A request failed in production at 02:14 and the only thing you have is console.log("error", err) somewhere in a route handler. You cannot tell which user hit it, which path, how long it took, or whether the three log lines you found even belong to the same request. That is the situation structured logging exists to prevent.
I run this site on a self-hosted VPS with Coolify – no platform log aggregation doing the work for me. Every request produces one JSON line on stdout, carries an ID I can grep for, and never prints a secret. This is the exact setup, straight from the codebase – not a toy example.
Why Structured, Not Strings
console.log gives you strings. Strings are fine until you need to answer a question like ‘show me every 500 on /api/contact in the last hour that took over a second.’ You cannot query a string. You end up writing fragile regexes against your own log format.
Structured logging means every log line is a JSON object with named fields:
{
  "level": "info",
  "time": "2026-08-21T00:14:03.921Z",
  "pid": 42,
  "service": "http",
  "requestId": "a1f3...",
  "method": "POST",
  "path": "/api/contact",
  "status": 200,
  "ms": 84,
  "msg": "[iurii.rogulia.fi] POST /api/contact 200 84ms"
}
Now the question is a filter: level=error AND path="/api/contact" AND ms>1000. Any log processor – jq locally, or a hosted backend if you add one later – can answer it. The msg field stays human-readable so you can also just eyeball the stream during development.
The point isn’t the tool. It’s the shape. Decide on your fields once, emit them everywhere, and every future question becomes a query instead of an archaeology project.
The Logger
Pino is a fast JSON logger for Node. The whole configuration is nine lines:
// lib/logger.ts
import pino from "pino";

export const logger = pino({
  level: process.env.LOG_LEVEL ?? "info",
  base: { pid: process.pid, service: "http" },
  msgPrefix: "[iurii.rogulia.fi] ",
  timestamp: pino.stdTimeFunctions.isoTime,
  formatters: { level: (label) => ({ level: label }) },
});
Every choice here earns its place:
levelfrom an env var – defaultinfo, but I can drop todebugin one deploy without touching code. Levels below the current one are compiled out, sologger.debug()calls cost almost nothing in production.baseaddspidandserviceto every line automatically. In a multi-process or multi-service setup you can tell log streams apart without threading the value through every call.msgPrefixtags the human-readable message. Useful when the same log backend collects several apps.timestamp: isoTimewrites ISO-8601 with aZsuffix instead of pino’s default epoch milliseconds. Machine-sortable, timezone-unambiguous, and it matches what I’d want to paste into an incident timeline.formatters.levellogs the level as its string label ("info","error") instead of pino’s default numeric code. I’d rather readlevel:"error"than memorize that50means error.
Pino writes to stdout. That’s deliberate – in a container, the application should not care where logs go. It writes lines to stdout, and the platform (Docker, Coolify, whatever collects the stream) decides on rotation, shipping, and retention. The twelve-factor rule holds: treat logs as an event stream, not a file the app manages.
One ID Per Request
A single request touches middleware first, then a route handler. If each of those logs independently with no shared identifier, you cannot reconstruct what happened. The fix is a request ID minted once and propagated.
In Next.js 16, middleware lives in proxy.ts (renamed from middleware.ts – I covered that migration here). This runs on every matched request:
// proxy.ts
import { NextRequest, NextResponse } from "next/server";
import { randomUUID } from "node:crypto";
import { logger } from "@/lib/logger";

export default function proxy(request: NextRequest) {
  const requestId = request.headers.get("x-request-id") ?? randomUUID();
  const path = request.nextUrl.pathname;
  const ua = request.headers.get("user-agent") ?? "";

  if (!shouldSkip(path, ua)) {
    logger.info(
      {
        requestId,
        method: request.method,
        path,
        ip: getIp(request),
        ua,
      },
      `${request.method} ${path}`
    );
  }

  const res = NextResponse.next();
  res.headers.set("x-request-id", requestId);
  return res;
}
Two things carry the whole design:
Generate or pass through. request.headers.get("x-request-id") ?? randomUUID(). If an upstream proxy or the client already set an x-request-id, we honor it. If not, we mint one. This is what lets an ID survive across service boundaries – a reverse proxy in front, or a client that wants to correlate its own request with your logs, sets the header once and every hop reuses it.
Echo it back. res.headers.set("x-request-id", requestId). The response carries the ID back to the caller. Now a user reporting a bug can hand you the ID from their network tab, and you grep one string to find their exact request. That one behavior turns ‘it broke sometime this afternoon’ into a five-second lookup.
The IP extraction is worth its own function, because behind a proxy request.ip is the proxy, not the user:
function getIp(req: NextRequest): string {
  return (
    req.headers.get("x-forwarded-for")?.split(",")[0]?.trim() ??
    req.headers.get("x-real-ip") ??
    "unknown"
  );
}
x-forwarded-for is a comma-separated chain; the first entry is the original client. Fall back to x-real-ip, then to "unknown" so the field is always present. Never a null field to trip up a downstream query.
Skip the Noise
Logging every request sounds thorough until your log stream is 90% favicon fetches and uptime pings. The skip list keeps signal high:
const UPTIME_UA_RE = /SentryUptimeBot|uptime|healthcheck|pingdom|statuscake|betteruptime/i;

function shouldSkip(path: string, ua: string): boolean {
  if (UPTIME_UA_RE.test(ua)) return true;
  if (path === "/api/health" || path === "/health") return true;
  if (path === "/favicon.ico" || path === "/robots.txt" || path === "/sitemap.xml") return true;
  if (/\.(svg|ico|png|jpg|jpeg|webp|js|css|map|woff2?|ttf)(\?|$)/.test(path)) return true;
  return false;
}
The path-based rules are obvious: static assets, favicon, robots, sitemap – none of these are interesting when you’re debugging a real request. The extension regex catches them in bulk, with (\?|$) so a query string doesn’t defeat the match.
The user-agent rule is the non-obvious part, and it comes from a real problem. Uptime probes hit real pages. SentryUptimeBot pings /, which is your homepage – you cannot filter it by path without also silencing real visitors. So health checkers get matched by User-Agent instead. Miss this and every 30-second uptime ping becomes a log line, and your actual traffic drowns.
One caveat: filtering by User-Agent is a signal-to-noise decision, not a security control. A UA is trivially spoofed, so this is fine for ‘stop logging my own monitoring’ and wrong for anything that needs to be trustworthy. Keep it in the right category.
Wrap the Route Handlers
Middleware logs that a request arrived. It does not log the outcome – status code and latency are decided inside the route handler, after middleware has already returned NextResponse.next(). For that you wrap the handler:
// lib/with-log.ts
import { logger } from "@/lib/logger";

export function withLog<C>(
  routeName: string,
  handler: (req: Request, ctx: C) => Promise<Response>
): (req: Request, ctx: unknown) => Promise<Response> {
  return async (req: Request, ctx: unknown) => {
    const start = Date.now();
    const requestId = req.headers.get("x-request-id") ?? crypto.randomUUID();
    try {
      const res = await handler(req, ctx as C);
      const ms = Date.now() - start;
      logger.info(
        { requestId, method: req.method, path: routeName, status: res.status, ms },
        `${req.method} ${routeName} ${res.status} ${ms}ms`
      );
      return res;
    } catch (err) {
      const ms = Date.now() - start;
      logger.error(
        { requestId, method: req.method, path: routeName, status: 500, ms, err },
        `${req.method} ${routeName} 500 ${ms}ms: ${(err as Error).message}`
      );
      throw err;
    }
  };
}
Usage is a one-liner around the handler:
// app/api/contact/route.ts
export const POST = withLog("/api/contact", async (req) => {
  // ...handle the request
  return Response.json({ ok: true });
});
What this buys:
- Latency on every route.
startis captured before the handler runs,mscomputed after. You get timing for free on both the success and failure paths. - Errors logged, then re-thrown. The
catchlogs aterrorlevel with the caughterr, thenthrows. It does not swallow the error – Next.js and Sentry still see it and produce the correct 500. The wrapper is an observer, not an owner. Swallowing here would be the classic mistake: a logged error that never reaches your error tracker, so the alert never fires. - The same request ID.
withLogreadsx-request-idfrom the request headers – the same header middleware stamped upstream – so the middleware line and the handler line share an ID.?? crypto.randomUUID()is a defensive fallback for the rare path that doesn’t pass through middleware.
There is deliberate duplication here: both proxy.ts and with-log.ts do header ?? randomUUID(). That is not an accident to refactor away. They run in different runtimes – middleware in the edge/proxy layer, the handler in the Node runtime – and coupling them through a shared import to save four lines trades a real boundary for false tidiness. Two honest reads of the same header beat one clever abstraction.
The <C> generic keeps the wrapper type-safe: your handler declares its own context type (route params, for instance), the wrapper accepts unknown from Next.js at the boundary and casts once, inside, where the shape is known.
Never Log a Secret
This is the rule that has no exceptions, and structured logging makes it easier to hold – because you log named fields, not ‘everything in this object.’
The failing patterns are always the same:
// don't
logger.info({ headers: Object.fromEntries(req.headers) }, "incoming"); // Authorization, cookies
logger.info({ body }, "payload"); // passwords, tokens, PII
logger.error({ err, config }, "boom"); // config often holds API keys
The moment you log a whole req, a whole request body, or a whole config object, you have almost certainly written an Authorization header, a session cookie, a password field, or an API key into a log line that will sit in a stream for as long as your retention allows.
The discipline that prevents it:
- Allowlist fields, never dump objects. Log
req.methodandreq.nextUrl.pathname, notreq. Every field in the examples above is named on purpose –requestId,method,path,status,ms,ip,ua. Nothing is a blind spread. - Log the outcome, not the payload. For the contact form I log that a submission happened and whether it succeeded. I do not log the message, the email, or the name. The status code answers the operational question; the content is none of the log’s business.
- Errors are the trap.
erris safe to log – but if you catch and log a whole config or the arguments that caused the failure, secrets ride along inside the error context. Log the message and stack, not the surrounding state. - Be careful with query strings. A path like
/reset?token=...puts a secret in thepathfield. If your routes carry sensitive query params, strip them before logging.
Structured logging doesn’t magically redact anything. It just means the default is a short list of named fields instead of a firehose – and a short list is something you can actually audit.
What You End Up With
Put together, every request through this site produces:
- One middleware line – request ID, method, path, IP, user-agent – for anything that isn’t a static asset or an uptime probe.
- One handler line – the same request ID, plus status and latency – for any route wrapped in
withLog. - A response header carrying the ID back to the caller.
When something breaks, the path is: get the x-request-id from the response (or the reporter), grep it, and read the two or three lines that describe exactly what happened and how long each part took. No SSH, no guessing which log lines belong together, no regex against unstructured strings.
None of this is a large amount of code – a nine-line logger, a middleware function, and a wrapper. That’s the point. Observability isn’t a platform you buy; it’s a shape you commit to and apply consistently. Error tracking (I use Sentry here) tells you that something failed. Structured logs tell you the sequence – what the request was, how long it took, and where in the flow it went wrong. You want both, and this is the log half.
Further reading:
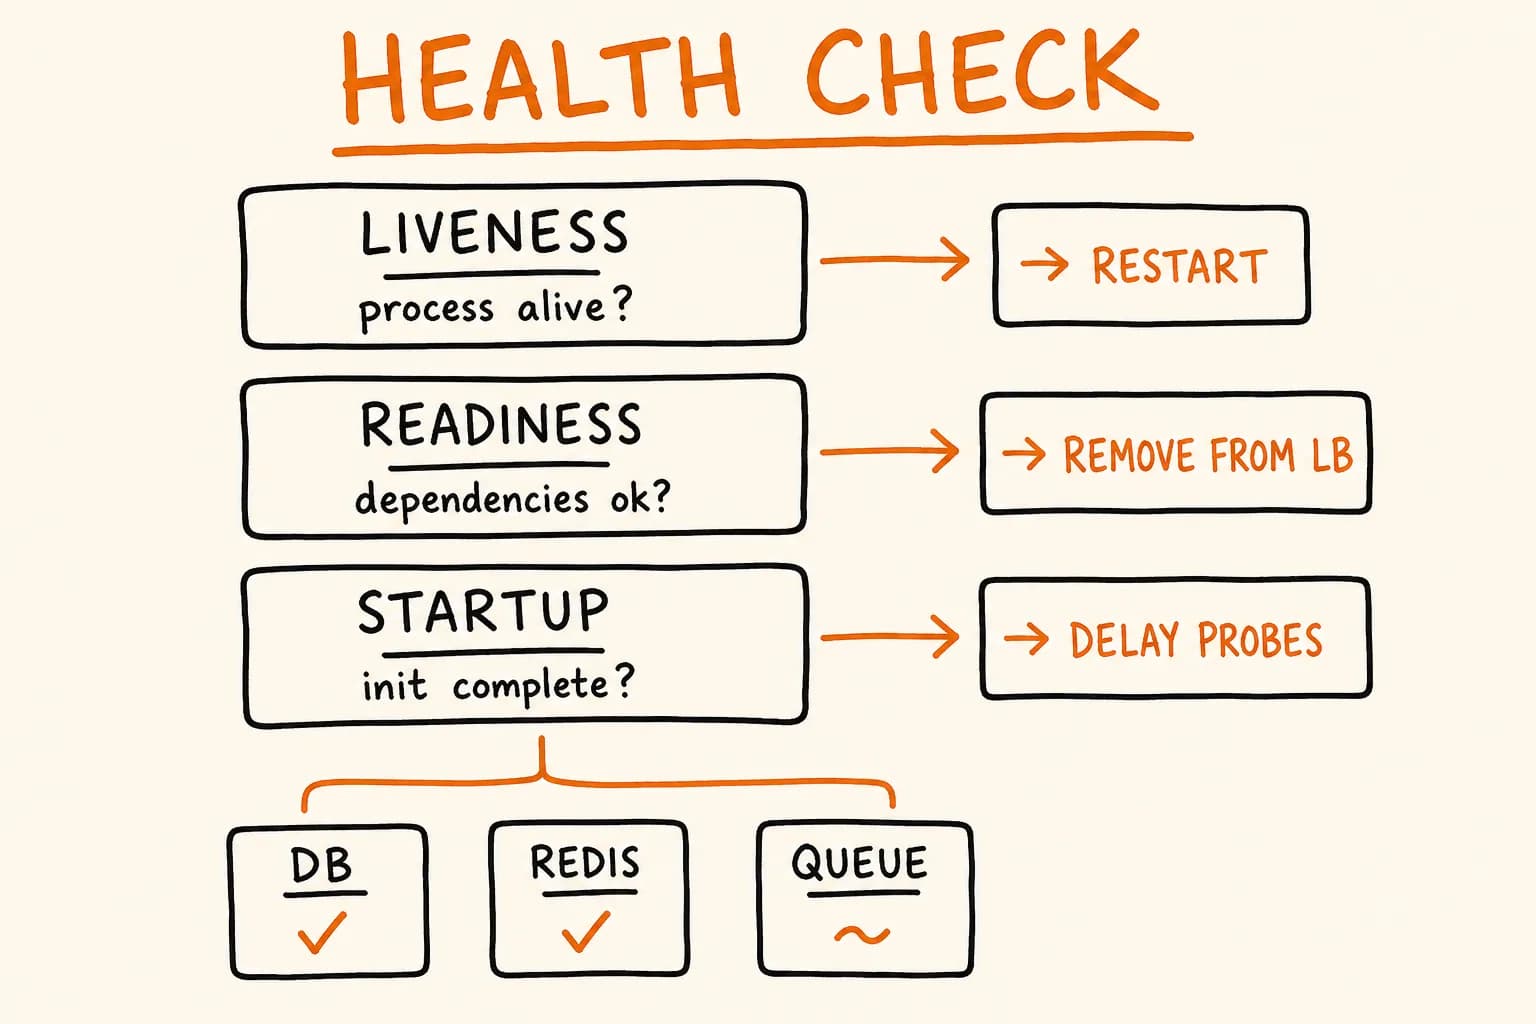
- Health Check Endpoint in Node.js: Liveness vs Readiness – the other half of knowing your service is alive
- Next.js 16 proxy.ts Migration: From middleware.ts – why middleware moved and how the file above got its name
- Idempotency Keys for API Retries – correctness under retries, where a shared request ID also earns its keep
- pino documentation
- The Twelve-Factor App – Logs