An error fires in production. Sentry catches it. You open the issue and the stack trace reads s at chunk-a1b2c3.js:1:48213. Useless. You know something broke, but not what, not where, and not why. On a self-hosted deployment there is no Vercel integration uploading source maps for you – if you do not wire it up yourself, every stack trace stays minified.
This site runs on a self-hosted Next.js standalone build behind Coolify – no Vercel, no platform doing the observability work for me. I set up Sentry so a production error resolves back to the exact line in the exact .ts file, and so the minified maps never ship to the browser. This is the setup, straight from the config that runs here.
Why Standalone Changes the Problem
A normal Next.js build assumes it runs on the machine that built it. A standalone build (output: "standalone" in next.config.ts) is different: it produces a self-contained bundle you copy into a container and run with node .next/standalone/server.js. The build machine and the run machine are not the same.
That matters for source maps in two ways:
- Nobody uploads maps for you. Vercel’s Sentry integration hooks into their build and uploads maps automatically. Self-hosted, that hook does not exist. The upload has to happen during your own build, before the artifact is shipped.
- You do not want the maps in the running bundle. Source maps are the keys to your minified code. If they end up served as static assets, anyone can un-minify your client bundle. They need to reach Sentry and then be deleted from the artifact.
The @sentry/nextjs SDK handles both – but only if the build is configured for it. Here is how each piece fits together.
Server, Edge, and Node: instrumentation.ts
Next.js runs your app across more than one runtime. Route handlers and Server Components run on Node.js. Middleware runs on the Edge runtime. Each needs Sentry initialised separately, because they are genuinely different environments with different globals.
instrumentation.ts at the project root is where Next.js lets you run code once, at server startup, per runtime. This is the whole file:
// instrumentation.ts
import * as Sentry from "@sentry/nextjs";

export async function register() {
  if (process.env.NEXT_RUNTIME === "nodejs") {
    await import("./sentry.server.config");
    // @ts-ignore – resolved by Next.js bundler, not TS module resolver
    await import("./instrumentation.node");
  }

  if (process.env.NEXT_RUNTIME === "edge") {
    await import("./sentry.edge.config");
  }
}

export const onRequestError = Sentry.captureRequestError;
Two things are doing work here.
The register() function branches on NEXT_RUNTIME and imports the matching config. The imports are dynamic (await import(...)) on purpose – you do not want to pull the Node SDK into an Edge bundle where half its dependencies do not exist. Edge gets sentry.edge.config; Node gets sentry.server.config plus a second file for process-level handlers (more on that below).
The onRequestError export is the part people miss. Next.js added a framework hook that fires whenever a request throws – a route handler, a Server Component render, a Server Action. Re-exporting Sentry.captureRequestError from instrumentation.ts wires that hook into Sentry. Without it, request errors that Next.js catches internally never reach Sentry, and you are left wondering why your issue count looks suspiciously low.
The two config files are deliberately minimal:
// sentry.server.config.ts
import * as Sentry from "@sentry/nextjs";

Sentry.init({
  dsn: "https://<public-key>@<org-id>.ingest.de.sentry.io/<project-id>",
  tracesSampleRate: process.env.NODE_ENV === "production" ? 0.1 : 1.0,
  sendDefaultPii: true,
  includeLocalVariables: true,
  debug: false,
});
The .ingest.de.sentry.io host is not cosmetic – this project lives in Sentry’s EU (Frankfurt) region, and the DSN region has to match where the project was created. If you copy a DSN from a US-region project into an EU account, events silently fail to ingest. Check the region in the DSN before anything else when events do not show up.
tracesSampleRate is 0.1 in production – one trace in ten – and 1.0 in development so you see everything locally. includeLocalVariables: true captures local variable values in the stack frames, which turns a ‘TypeError: cannot read property x of undefined’ into something you can actually reason about. sendDefaultPii: true attaches request context (IP, headers); decide that one against your own privacy posture – on a public portfolio it is fine, on a health app it is not.
The edge config is the same minus includeLocalVariables, which the Edge runtime does not support.
Catching What the Framework Doesn’t
onRequestError covers errors that flow through a request. It does not cover an uncaught exception in a background worker, or a promise rejection nobody awaited. Those crash the Node process – or leave it running in a broken state – without ever touching a request handler.
That is the second Node-only import, instrumentation.node.ts:
// instrumentation.node.ts
import * as Sentry from "@sentry/nextjs";
import { logger } from "./lib/logger";

process.on("uncaughtException", (err) => {
  logger.fatal({ err }, `uncaughtException: ${err.message}`);
  Sentry.captureException(err);
});

process.on("unhandledRejection", (err) => {
  const message = err instanceof Error ? err.message : String(err);
  logger.error({ err }, `unhandledRejection: ${message}`);
  Sentry.captureException(err);
});
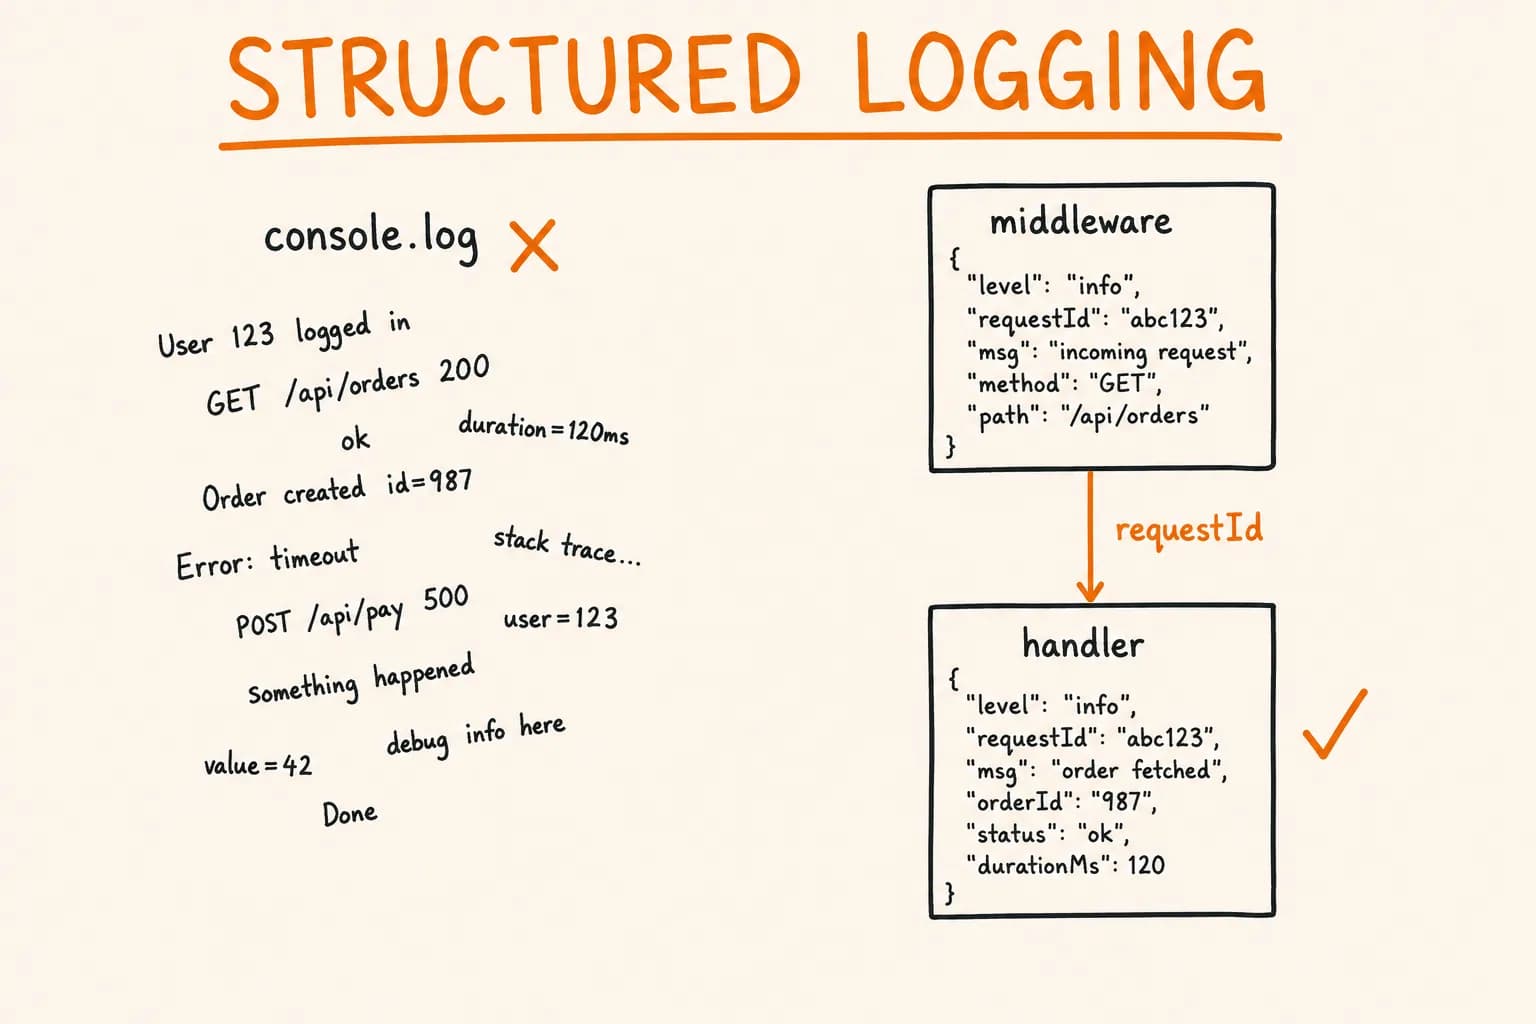
It logs to the structured logger and reports to Sentry at the same time. Two destinations, on purpose: the log line lands in stdout where the container captures it, and the Sentry event gives you the grouped, symbolicated view. A process-level crash is exactly the kind of thing you want in both places.
This file is Node-only because process.on does not exist on the Edge runtime, which is why it is imported inside the NEXT_RUNTIME === "nodejs" branch and not at the top of instrumentation.ts.
The Build Step That Makes Traces Readable
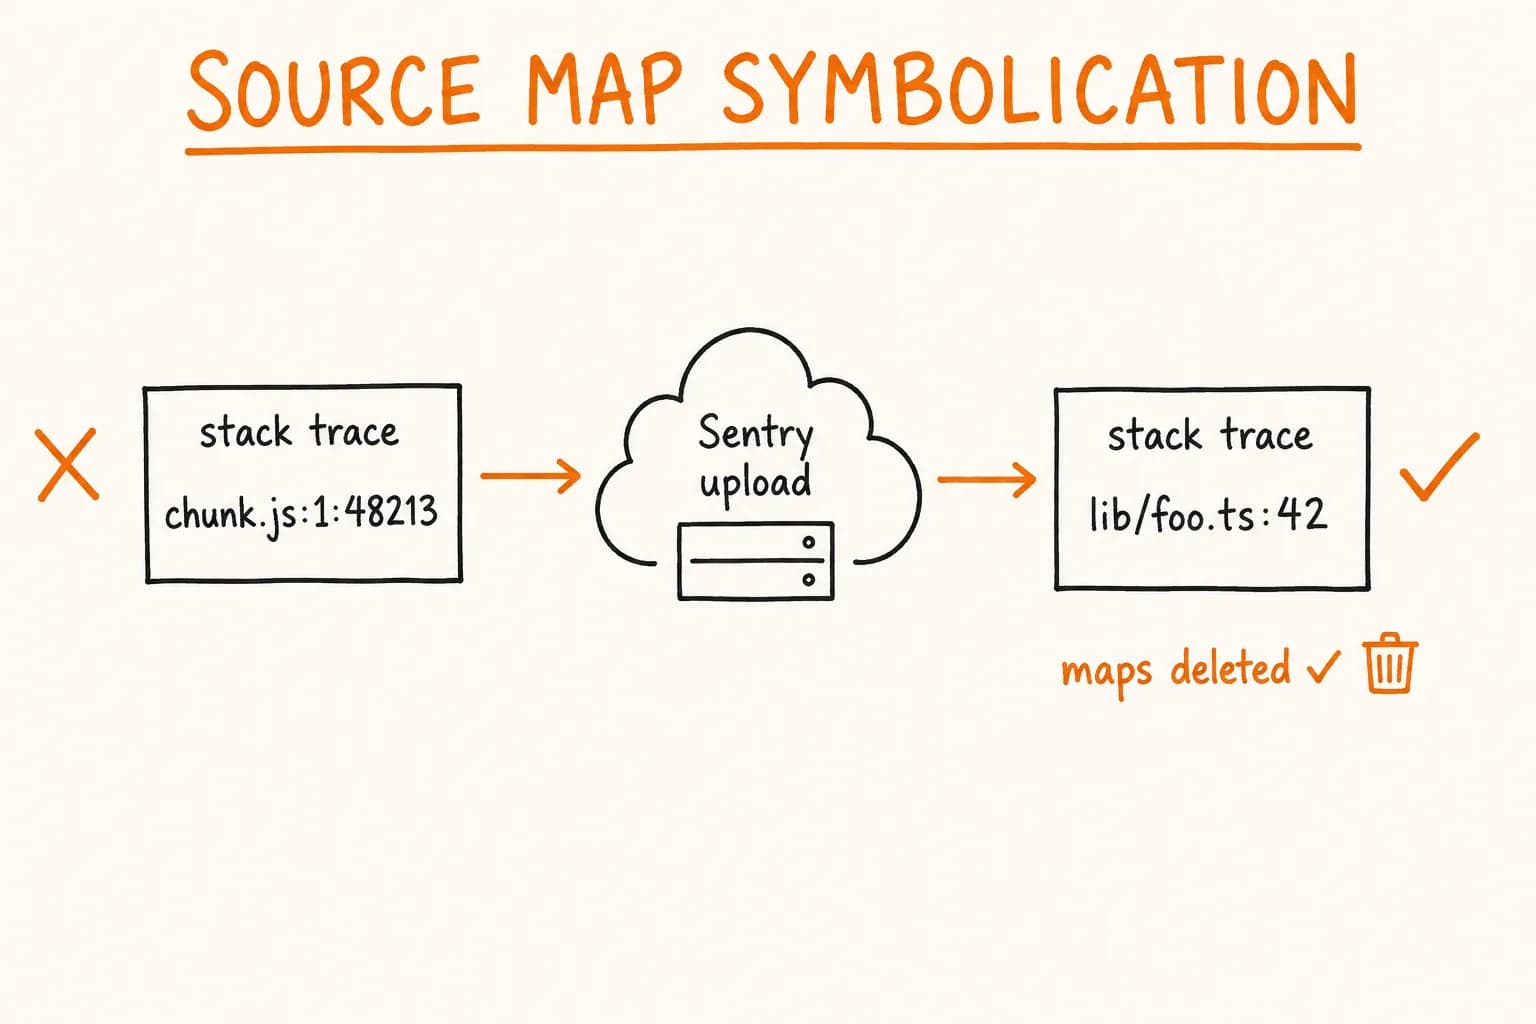
Everything above gets you Sentry events. It does not get you readable ones. Symbolication – turning chunk.js:1:48213 back into lib/foo.ts:42 – needs the source maps uploaded to Sentry and correlated with the deployed bundle by a shared release ID. That is what withSentryConfig does at build time.
You wrap the exported Next config:
// next.config.ts
import { withSentryConfig } from "@sentry/nextjs";

const nextConfig = {
  output: "standalone",
  // ...the rest of your config
};

export default withSentryConfig(nextConfig, {
  org: "iurii-rogulia",
  project: "rogulia",
  silent: !process.env.CI,
  widenClientFileUpload: true,
  tunnelRoute: "/monitoring",
  webpack: {
    treeshake: {
      removeDebugLogging: true,
    },
    automaticVercelMonitors: false,
  },
});
withSentryConfig injects a webpack/build plugin that, during next build, does three things: generates source maps, uploads them to the org/project you named, and – this is the part that protects you – deletes the client source maps from the output so they never reach the browser. You get symbolicated traces in Sentry and a bundle that leaks nothing. You do not opt into the deletion; it is the default behaviour of the upload plugin, which is exactly the right default.
Walking the options that matter:
org/project– where maps get uploaded. This Sentry account is multi-project, so gettingprojectright matters: point it at the wrong project and your maps upload somewhere your events don’t. Theorg/project/region trio has to be internally consistent – same region as the DSN above.silent: !process.env.CI— quiet locally, verbose in CI. When an upload fails, you want the noise in the CI log where you’ll actually read it, not buried in your local dev output.widenClientFileUpload: true— uploads a broader set of client artifacts. Next.js splits client code across chunks in ways that can leave gaps in what gets mapped; widening the net trades a slightly slower upload for traces that don’t have blind spots.tunnelRoute: "/monitoring"— proxies Sentry’s browser SDK requests through your own domain instead of hitting Sentry directly. Ad blockers and strict CSP block requests to*.sentry.io; a same-origin tunnel route means those events still get through. It also keeps your CSP simpler –connect-src 'self'covers it.
The auth token is the one thing that is not in this config, and must not be. Uploading maps to Sentry needs SENTRY_AUTH_TOKEN as an environment variable in the build environment. It is a write credential for your Sentry project – it belongs in your CI/build secrets, never committed. If the build logs say maps were skipped, a missing or unscoped auth token is the first suspect.
Ordering It in a Standalone Build
One trap specific to standalone: the Sentry upload runs during next build, so the build environment is the only place the maps exist with the right context. Your container build has to run next build with SENTRY_AUTH_TOKEN present – not copy a pre-built artifact and hope.
In this project the runtime image is assembled after the build: the standalone server plus .next/static and public/ get copied into the final bundle, and the container starts node .next/standalone/server.js. By the time that copy happens, the client source maps are already uploaded and already deleted from .next/static. The artifact that ships carries no maps. That ordering is the whole point – upload happens at build, deletion happens at build, and the thing you deploy is clean.
If you build inside CI and deploy a separate image, the rule is the same: the auth token has to be present in the step that runs next build, because that is the step doing the upload.
Verifying Symbolication Actually Works
Do not trust that it works because the build didn’t error. Prove it. Throw a real error from a deployed route and read the trace.
A throwaway route handler is enough:
// app/api/debug-sentry/route.ts — remove after verifying
export function GET() {
  throw new Error("Sentry symbolication check");
}
Deploy, hit /api/debug-sentry, and open the issue in Sentry. You are checking three things:
- The event arrived at all. If it didn’t, suspect the DSN region mismatch first (
.de.vs.us.), then theNEXT_RUNTIMEbranch ininstrumentation.ts. - The trace is symbolicated. The top frame should read
app/api/debug-sentry/route.ts, not a hashed chunk name. Minified frames mean the maps didn’t upload – checkSENTRY_AUTH_TOKENand the CI log for upload errors. - The release matches. Sentry links maps to events by release ID. If the deployed code and the uploaded maps carry different releases, you get ‘source map found but no matching release’ – usually a sign the build and deploy drifted out of sync.
Then delete the route. A public endpoint that throws on demand is not something you want to leave behind for anyone probing your site.
One more browser-side check: open the deployed site, look at the Network tab, and confirm no .map files are being served from /_next/static. If they are, the deletion step didn’t run – almost always because the upload failed and the plugin skipped its own cleanup. Fix the upload and the deletion follows.
Where This Stops Being Enough
This setup gives you readable server and client errors on a self-hosted standalone build, with maps that never leak. It is the baseline, not the whole story.
It does not give you:
- Meaningful sampling decisions.
tracesSampleRate: 0.1is a flat 10%. Once you have real traffic you’ll want to sample by route, keep all errors and slow transactions, and drop the healthy ones – atracesSamplerfunction, not a fixed rate. - Session replay or profiling. Both are separate SDK features with their own cost and privacy trade-offs. Turn them on deliberately, not by default.
- Release automation. The release IDs work, but wiring commit SHAs and deploy markers into Sentry so you can see ‘this error started with that deploy’ is a further step I’d add for anything with a real release cadence.
For a portfolio site the baseline is the right amount of observability. For a product people pay for, it is the floor you build up from.
The whole point of source maps in production is that when something breaks, you are debugging your actual code instead of guessing at minified output. On a managed platform that comes for free. Self-hosted, it is four files and a build-time upload – but each piece has to be right, and the failure modes are quiet: a region mismatch, a missing token, a map that leaked. Get them right once and every future error points you straight at the line that caused it.
If you are standing up observability on a self-hosted stack and want it wired correctly the first time – Sentry, source maps, structured logging, tracing – that is exactly the kind of work I do. I’m available for technical consultation and longer engagements.
Further reading:
- Sentry for Next.js – official SDK docs
- Next.js instrumentation and
onRequestError - Next.js standalone output
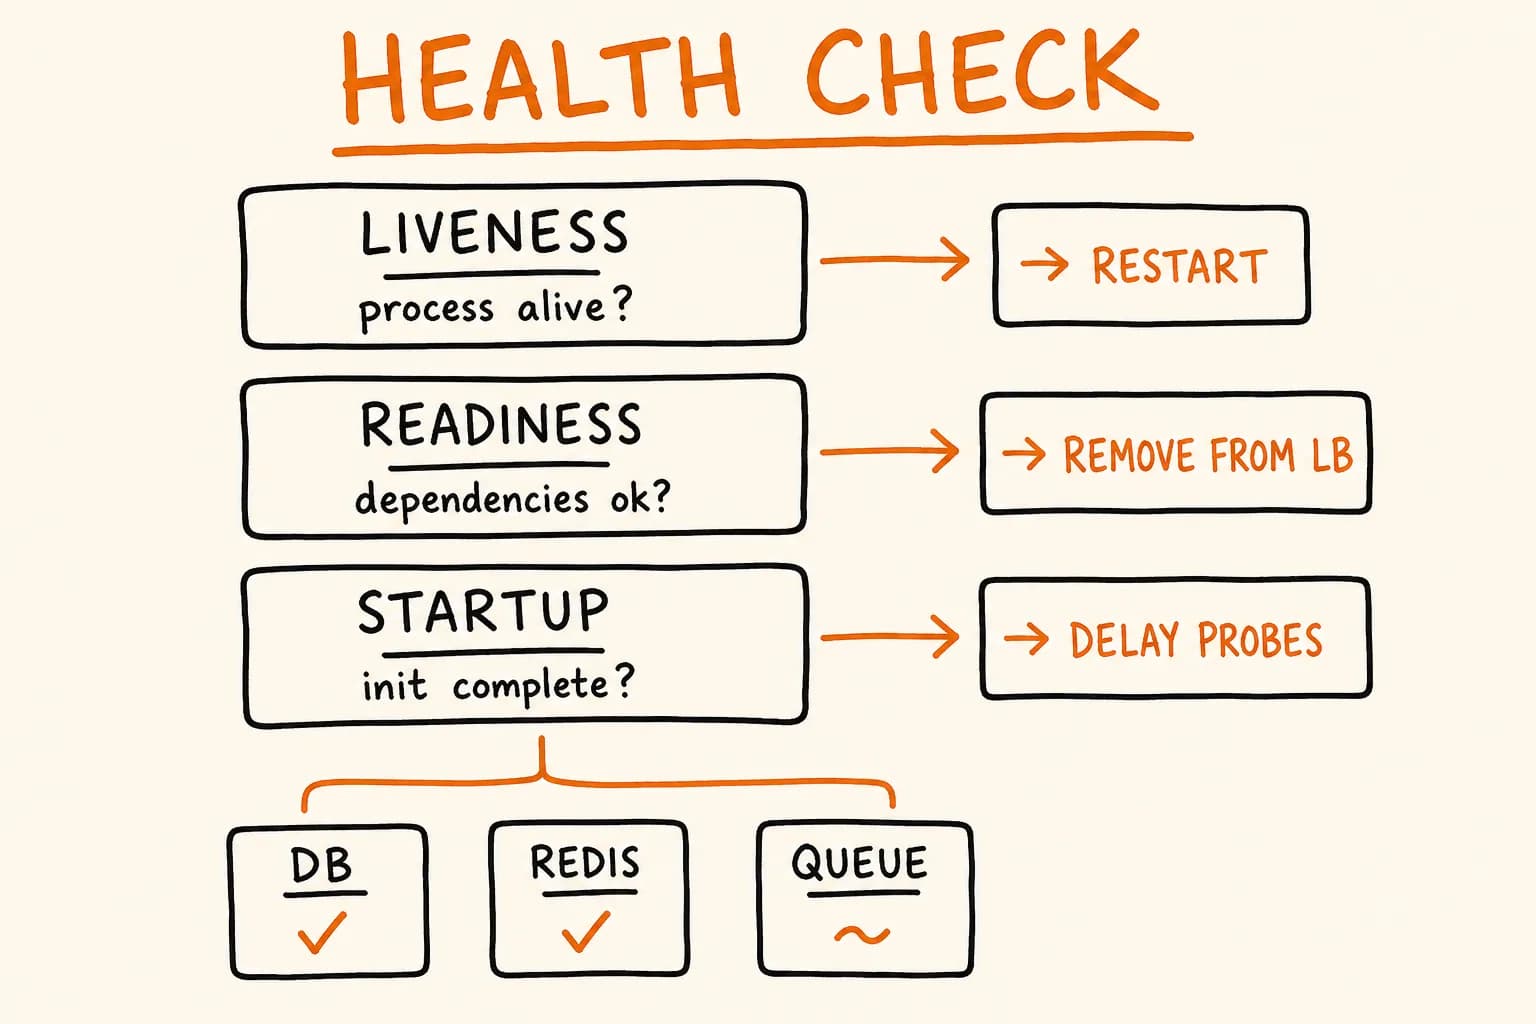
- Health Check Endpoint in Node.js – the other half of production reliability